

In this tutorial we will determine the resonance assignments and the structure of a protein-ligand complex using modules of CYANA.
To this end we will first run the CYANA module FLYA to obtain the resonance assignments from backbone, side chain and NOESY experiments (actually, the XEASY peak lists of these experiments).
Then we will use noeassign to assign the NOESY spectra and calculate the holo protein structure without the ligand.
In a next step we will first draw the ligand, convert the obtained SMILES code to a *.mol2 file and generate the *.lib file for CYANA.
Then we will assign intermolecular peaks lists and redo the structure calculation, this time of the protein-ligand complex.
To finalize you will compare the calculated NMR structure to an X-ray structure and generate statistics.
And ultimately you can try to improve your structure results by studying and applying the options available within the FLYA and noeassign modules of CYANA.
Content
|
CYANA setup
Please follow the following steps carefully (exact Linux commands are given below; you may copy them to a terminal):
- Go to your home directory (or data directory).
- Get the data for the practical from the server (data.zip).
- Unpack the input data for the practical.
- Get the demo version of CYANA for this practical.
- Unpack CYANA.
- Setup the CYANA environment variables.
- Change into the newly created directory 'data'.
- Copy the demo_data directory to 'flyabb'.
- Change into the subdirectory 'flyabb'.
- Test whether CYANA can be started by typing its name, 'cyana'.
- Exit from CYANA by typing 'q' or 'quit'.
- Download Chimera (to your personal laptop) from: Chimera
- Download Avogadro (to your personal laptop) from: Avogadro
cd ~
cp /home/julien/data.zip .
tar zxf data.zip

wget 'http://www.cyana.org/wiki/images/6/64/Cyana-3.98bin-180213Demo.tgz'
tar zxf Cyana-3.98bin-180213Demo.tgz
cd cyana-3.98/
./setup

cd ~

cd data
cp -r demo_data flyabb
cd flyabb
cyana
___________________________________________________________________

CYANA 3.98 (mac-intel)

Copyright (c) 2002-17 Peter Guentert. All rights reserved.
___________________________________________________________________

    Demo license valid for specific sequences until 2018-12-31

    Library file "/Users/deans/cyana-3.98/lib/cyana.lib" read, 41 residue types.
*** ERROR: Illegal residue name "LIG".
*** ERROR: Cannot read line 114:
           LIG  333
cyana> q
If all worked, you are ready to go in terms of everything related to CYANA! The reason you see the ERROR message, is because you have a sequence file in the directory, but not a library file for the ligand yet. Don't worry, this is as expected and you will take care of it during the exercise.
If you want to return to your practical later, using your own Linux or Mac OS X computer, you can download the demo version of CYANA from here.
Hint: More information on the CYANA commands etc. is in the CYANA 3.0 Reference Manual.
Automated resonance assignment
Resonance assignment within CYANA is done using the module FLYA.
In the most general sense, there are two type of experiments used for protein resonance assignments. Through bond kind of experiments (like TOSCY, COSY) and through space type of experiments (like NOESY). Each of these experiments carries distinct information that help the resonance assignment. The HSQC or HMQC elements of these experiments merely help the resolution, by allowing the separation of resonances according to spin types (1H, 13C, 15N) into additional dimensions.
At the very minimum, for small systems and in favorable cases, a NOESY experiment may be sufficient to get an assignment and enough distance restraints for a structure calculation.
Experimental input data
Spectra are processed and referenced relative to each other. Peak lists in XEASY format are prepared by automatic peak picking with a visualization program such as CcpNmr Analysis, NMRdraw or NMRview and saved as XXX.peaks, where XXX denotes the name of the XEASY peak list file. Then they are cleaned (unnecessary water and noise peaks removed).
As part of the data supplied for the exercises, experimental peak lists are available for the following spectra:
- HNtrosy (spectrum type 'N15HSQC' in the CYANA library)
- trHNCA (spectrum type 'HNCA' in the CYANA library)
- HNCOCA (spectrum type 'HNcoCA' in the CYANA library)
- HNCACB (spectrum type 'CBCANH' in the CYANA library)
- HCCCHTOCSY (the spectrum type will have to be determined in the first exercise)
- NTOCSY (spectrum type 'N15TOCSY' in the CYANA library)
- 3D 13C-resolved NOESY called aro (spectrum type 'C13NOESY' in the CYANA library)
- 3D 13C-resolved NOESY called cnoesy (spectrum type 'C13NOESY' in the CYANA library)
- 3D 15N-resolved NOESY called nnoesy (spectrum type 'N15NOESY' in the CYANA library)
Each peak list starts with a header that defines the experiment type and the order of dimensions. For instance, for HNCA.peaks:
# Number of dimensions 3
#FORMAT xeasy3D
#INAME 1 HN
#INAME 2 C
#INAME 3 N
#SPECTRUM HNCA HN C N
      5   6.475  58.033  98.548 1 U   2.769E+02  0.000E+00 e 0     0     0     0
      6   6.476  62.123  98.126 1 U   2.571E+01  0.000E+00 e 0     0     0     0
      7   6.475  54.017  98.159 1 U   2.547E+01  0.000E+00 e 0     0     0     0
The first line specifies the number of dimensions (3 in this case). The '#SPECTRUM' (no space between characters) lines gives the experiment type (HNCA, which refers to the corresponding experiment definition in the CYANA library), followed by an identifier for each dimension of the peak list (HN C N) that specifies which chemical shift is stored in the corresponding dimension of the peak list. The experiment type and identifiers must correspond to an experiment definition in the general CYANA library (see below). If a definition is missing for an experiment it must be added to the CYANA library. After the '#SPECTRUM' line follows one line for every peak. For example, the first peak in the 'HNCA.peaks' list has
- Peak number 5
- HN chemical shift 6.475 ppm
- C (CA) chemical shift 58.033 ppm
- N chemical shift 98.548 ppm
The other data are irrelevant for automated chemical shift assignment with FLYA. In particular, the peak volume or intensity (2.769E+02) is not used by the algorithm.
Hint: The formats of other CYANA files are described in the CYANA 3.0 Reference Manual.
The protein sequence is supplied by three-letter code in a XXX.seq file.
As part of the supplied data for the exercises there are two sequences:
- demoShort.seq (the protein sequence alone)
- demoLong.seq (the protein sequence, ligand and a linker that connects the two molecules)
Linker sequences serve to keep two or more molecules close in coordinate space during calculations, is usually between 15-20 elements long and is composed of dummy atoms that allow the linking.
SPECTRUM definitions in the CYANA library
When you start CYANA, the program reads the library and displays the full path name of the library file. You can open the standard library file to inspect, for example, the NMR experiment definitions that define which expected peaks are generated by FLYA. For instance, the definition for the HNCA spectrum (search for 'HNCA' in the library file 'cyana.lib') is
SPECTRUM HNCA  HN N C
 0.980  HN:H_AMI  N:N_AM*  C:C_ALI  C_BYL
 0.800  HN:H_AMI  N:N_AMI  (C_ALI) C_BYL  C:C_ALI
The first line corresponds to the '#SPECTRUM' line in the peak list. It specifies the experiment name and identifies the atoms that are detected in each dimension of the spectrum. The number of identifiers defines the dimensionality of the experiment (3 in case of HNCA).
Each line below defines a (formal) magnetization transfer pathway that gives rise to an expected peak. in the case of HNCA there are two lines, corresponding to the intraresidual and sequential peak. For instance, the definition for the intraresidual peak starts with the probability to observe the peak (0.980), followed by a series of atom types, e.g. H_AMI for amide proton etc. An expected peak is generated for each molecular fragment in which these atom types occur connected by single covalent bonds. The atoms whose chemical shifts appear in the spectrum are identified by their labels followed by ':', e.g. for HNCA 'HN:', 'N:', and 'C:'. The additional atom types refer to atoms that are not detected but must be present in a matching molecular fragment. An atom type in parenthesis indicates a branch in the molecular fragment. For instance, in the second magnetization transfer pathway that specifies the sequential HNCA peak, '(C_ALI)' indicates that the atom 'N:N_AMI' must be connected by a covalent bond to both a C_ALI (i.e. CA) and a C_BYL (i.e. C' of the preceding residue).
Exercise 1: Determine the spectrum type
For the HCCCHToscy, determine the spectrum type and put the definition in the HCCCHTocsy.peaks file with the appropriate syntax.
The experiment is a TOCSY, a through-bond experiment. It allows you to see, in this case, from the backbone all the way out into the side chains.
- Use the less command (to view files in the terminal but not change) to search the spectrum type in the 'cyana.lib' file.
Hint: Look at the definitions themselves and not just the SPECTRUM names, to determine which TOCSY is the appropriate one. Take the experiment with the most through-bond transfers.
- work in the copy of the data directory ('cd flyabb')
- Use a graphic text editor (or if you feel comfortable, use the vi terminal text editor) to manipulate the HCCCHTOCSY.peaks file and enter the appropriate spectrum type and identifiers in the correct order.
- Check that the order of the dimensions in your SPECTRUM definition matches the actual experiment.
Depending on how the xeasy peak file was generated, the order of the dimensions does not have to match the way experiments are recorded, and of course they do not in general match the SPECTRUM definition given in the 'cyana.lib' file. If it does not match, do not change it in the 'cyana.lib' file but switch the order of the atom labels it in the definition you add to your '*.peaks' file.
Hint: A quick determination of the order of the dimensions and atom types, can be done by looking at the columns of the chemical shifts and detect the chemical shift patterns.
This may be harder than it sounds at first instance, take your time to detect the pattern if it is not immediately obvious to you.
As you know, the chemical shifts of specific atom types and groups are quite distinct. If you need help with the chemical shift statistics, go to: BMRB
Hint: For information on how to use the vi terminal editor: vi editor
Exercise 2: Run FLYA
- work in the copy of the data directory ('cd flyabb')
Using the text editor of your choice, create your 'init.cya' macro as outlined (The init macro) and also your 'CALC.cya' macro (The FLYA CALC macro) to run FLYA. Be extra careful to avoid typos and unwanted spaces in coma lists etc.
Execution scripts or "macros" in CYANA
For more complex task within CYANA, rather than to enter the execution commands line by line at the CYANA prompt, the necessary commands are collected in a file named '*.cya'. Collecting the commands in macros has the added advantage, that the macros serve as a record allowing to reconstruct previous calculations.
The init macro
The initialization macro file has the fixed name 'init.cya' and is executed automatically each time CYANA is started. It can also be called any time one wants to reinitialize the program by typing 'init'. It contains normally at least two commands that read the CYANA library and the protein sequence:
rmsdrange:=15-111
cyanalib
read demoShort.seq
The first line sets the appropriate rmsdrange, and the command 'cyanalib' reads the standard CYANA library. The next command reads the protein sequence.
The protein sequence is stored in three-letter code in the file 'demo.seq'.
The FLYA CALC macro
The 'CALC.cya' starts with the specification of the names of the input peak lists:
peaks:=aro,cnoesy,nnoesy,HNtrosy,trHNCA,HNCOCA,HNCACB,NTocsy,HCCCHTocsy
The peak list names are separated by commas (without blanks!). The files on disk have the file name extension .peaks, e.g. 'HNCA.peaks'.
The command above will use all available peak lists. You can choose any subset of them by modifying the 'peaks:=...' statement.
These are followed by tolerances for chemical shift matching:
assigncs_accH=0.03
assigncs_accC=0.4
assigncs_accN=assigncs_accC
tolerance:=$assigncs_accH,$assigncs_accH,$assigncs_accC
In this case, a tolerance of 0.03 ppm will be used for protons, and 0.4 ppm for carbon and nitrogen. The 'assigncs_accX' variables are used within flya, the tolerance variable is used in consolidation.
The next parameter specifies the seed value for the random number generator (an arbitrary positive integer is ok).
randomseed=101
The next parameter chooses the "quick" optimization schedule in order to speed up the calculation for this practical:
shiftassign_quick=.true.
In production runs, better results can be expected (at the expense of longer computation times) if this parameter is not set. The next command specifies that swapping of diastereotopic pairs is optimized with respect to the supplied reference assignment (only applied during consolidation):
shifts_consolidate_swap=.true.
Finally, there is the command to start the FLYA algorithm:
flya runs=10 assignpeaks=$peaks shiftreference=manREF.prot
Here, the given parameters of the 'flya' command specify the following:
- The number of independent runs of the algorithm, from which the consolidated shift will be calculated (chosen smaller than in normal production runs in order to speed up the calculation).
- The input peak lists that will be used (as defined above).
- An ensemble of random structures will be calculated for generating expected peaks (leads to prediction of short range NOES in NOESY-type experiments).
- The results will be compared with the reference chemical shifts in the file 'manREF.prot' (which have been determined by conventional methods).
When you have prepared the 'init.cya' and the 'CALC.cya' start your FLYA ('CALC.cya') macro using 10 processors by calling it as outlined just below. It will take between 10-20 minutes (depending on your system) to complete the assignment, once the calculation starts.
To run the FLYA calculation, one could start CYANA and execute the 'CALC.cya' macro from the CYANA prompt, however on a computer with multiple processors it is better to speed up the calculation by running the 'CALC.cya' macro in parallel:
cyana -n 10 CALC.cya
This starts 10 independent calculations on 10 processors by using the MPI scheduler (if installed on your system, otherwise shared memory will be used).
It is strongly recommended that you check the MPI scheduler if your calculation is running. If you made a mistake in one of the two macros, the calculation may or may not start, or get interrupted at some point.
ls -ltr
This command allows you to check whether the calculation has generated intermediary files or final results, with a time stamp.
If you have only one CPU you can start the macro with:
cyana CALC.cya
To check the general load on your local computer use:
top
To kill all processes running (from you):
skill -u <username>
FLYA output files
The FLYA algorithm will produce the following output files:
- flya.prot: Consensus assigned chemical shifts. This file contains a chemical shift for every atom that has been assigned to least one peak.
- flya.tab: Table with details about the chemical shift assignment of each atom (comparison with reference shifts). In this file you can see for each atom whether the assignment is "strong" (self-consistent) or "weak" (only tentative).
- flya.txt: Assignment statistics
- flya.pdf: Graphical representation of the assignment results
- XXX_exp.peaks: List of expected peaks, corresponding to input peak list XXX.peaks
- XXX_asn.peaks: Assigned peak list, corresponding to input peak list XXX.peaks
The flya.txt file
This output file starts with overall assignment statistics for each group of atoms as defined by 'analyzeassign_group:=...':
   ____________________________________________________________

   CHEMICAL SHIFT ASSIGNMENT
   ____________________________________________________________
    SEED: 1
    chemical shifts for 1151  atoms found
    Peaks assigned from frequencies

    BB: REFERENCES(2):365 CHEMICALSHIFTS(1):373 (1)and(2):365 MATCH:364(99.7% of (2))
- REFERENCES(2) is the number of reference assignments (in the selected group)
- CHEMICALSHIFTS(1) is is the number of atoms assigned by FLYA
- (1)and(2) is the number of atoms that are assigned by FLYA and in the reference.
- MATCH is the number of atoms with the same assignment by FLYA and in the reference. The percentage is relative to the number of reference assignments.
Further below comes a table with information about each peak list:
    Lists      #Expected  noRef   noPeak   Assigned        Match    #Measured   Assigned    exp/meas Assigned
    aro           4732    1212    3334   218(  4.61%)   103(  2.18%)    121     72( 59.50%)   3.0
    cnoesy        4732    1212    1277  3098( 65.47%)  2163( 45.71%)   2904   2123( 73.11%)   1.5
    nnoesy        1562     429     285   958( 61.33%)   832( 53.27%)    970    785( 80.93%)   1.2
    HNtrosy        141      35      16    94( 66.67%)    90( 63.83%)    105     90( 85.71%)   1.0
    trHNCA         183       3       4   178( 97.27%)   176( 96.17%)    180    176( 97.78%)   1.0
    HNCOCA          91       1       1    89( 97.80%)    89( 97.80%)     94     89( 94.68%)   1.0
    HNCACB         356       4      53   300( 84.27%)   297( 83.43%)    290    287( 98.97%)   1.0
    NTocsy         610     172     131   338( 55.41%)   303( 49.67%)    306    290( 94.77%)   1.2
    HCCCHTocsy    2757     738    1474   780( 28.29%)   533( 19.33%)   1429    480( 33.59%)   1.6
    ALL          15164    3806    6575  6053( 39.92%)  4586( 30.24%)   6399   4392( 68.64%)   1.4
It contains the following data:
- #Expected: Total number of expected peaks
- noRef: Number of expected peaks with missing reference shifts
- noPeak: Number of expected peaks for which no peak can be measured
- Assigned: Number of expected peaks that could be assigned based on the reference chemical shift assignments. The theoretical maximum of 100% corresponds to the situation that the spectra “explain” all expected peaks. Each expected peak can be mapped to at most one measured peak. Remaining expected peaks correspond to missing peaks in the measured peak list.
- Match: Number of assigned peaks that fit (within tolerance) reference shifts. The theoretical maximum of 100% corresponds to having all measured peaks assigned. Note that several expected peaks can be mapped to the same measured peak, i.e. the assignments of measured peaks can be unambiguous or ambiguous. Remaining unassigned measured peaks are likely to be artifacts.
- #Measured: Total number of peaks in peak list
- Assigned: Number of measured peaks that could be assigned to expected peaks
- exp/meas: Ratio of assigned expected and measured peaks
There is more information on the results of the assignment calculation in the 'flya.txt' file (not described here).
The flya.tab file
This file provides information about the chemical shift assignment of each individual atom:
   Atom  Residue      Ref   Shift     Dev  Extent  inside   inref
   ...
    N     GLY   15         108.212            10.0    60.0     0.0
    H     GLY   15           8.088            10.0    61.1     0.0
    CA    GLY   15          44.874            10.0    73.9     0.0
    HA2   GLY   15           3.705            10.0    39.4     0.0
    HA3   GLY   15           4.147            10.0    40.0     0.0
    CA    PRO   16  62.547  62.554  -0.007    10.0   100.0   100.0  strong=
    HA    PRO   16   4.211   4.213  -0.002    10.0    99.9   100.0  strong=
    CB    PRO   16  31.786  31.791  -0.005    10.0    99.9   100.0  strong=
    HB2   PRO   16   1.675   1.670   0.005    10.0    79.7    80.0  =
    HB3   PRO   16   2.027   2.027   0.000    10.0   100.0   100.0  strong=
    CG    PRO   16  26.536  26.533   0.003    10.0   100.0   100.0  strong=
    HG2   PRO   16           1.727            10.0    99.9     0.0  strong
    HG3   PRO   16   1.726   1.727  -0.001    10.0   100.0   100.0  strong=
    CD    PRO   16  49.122  49.122   0.000    10.0    90.0    90.0  strong=
    HD2   PRO   16   3.282   3.287  -0.005    10.0    99.8   100.0  strong=
    HD3   PRO   16   3.304   3.290   0.014    10.0    89.9    90.0  strong=
...
- Ref: Chemical shift value in the reference chemical shift list (ref.prot). It was not used in the calculation.
- Shift: Consensus chemical shift value from FLYA
- Dev = Ref - Shift
- Extent: Number of runs in which the atom was assigned by FLYA.
- Inside: Percentage of chemical shift values from the (10) independent runs of FLYA that agree (within the tolerance) with the consensus value.
- inref: Percentage of chemical shift values from the (10) independent runs of FLYA that agree (within the tolerance) with the reference value.
- Outcome of the assignment:
- strong: "strong" assignment, i.e. Inside > 80%.
- =: Assignment that agrees with reference, i.e. Dev < tolerance.
- !: Assignment that does not agree with the reference, i.e. Dev > tolerance.
- (atom name): Correct assignment, if within the same residue (no residue number given), or the neighboring residues.
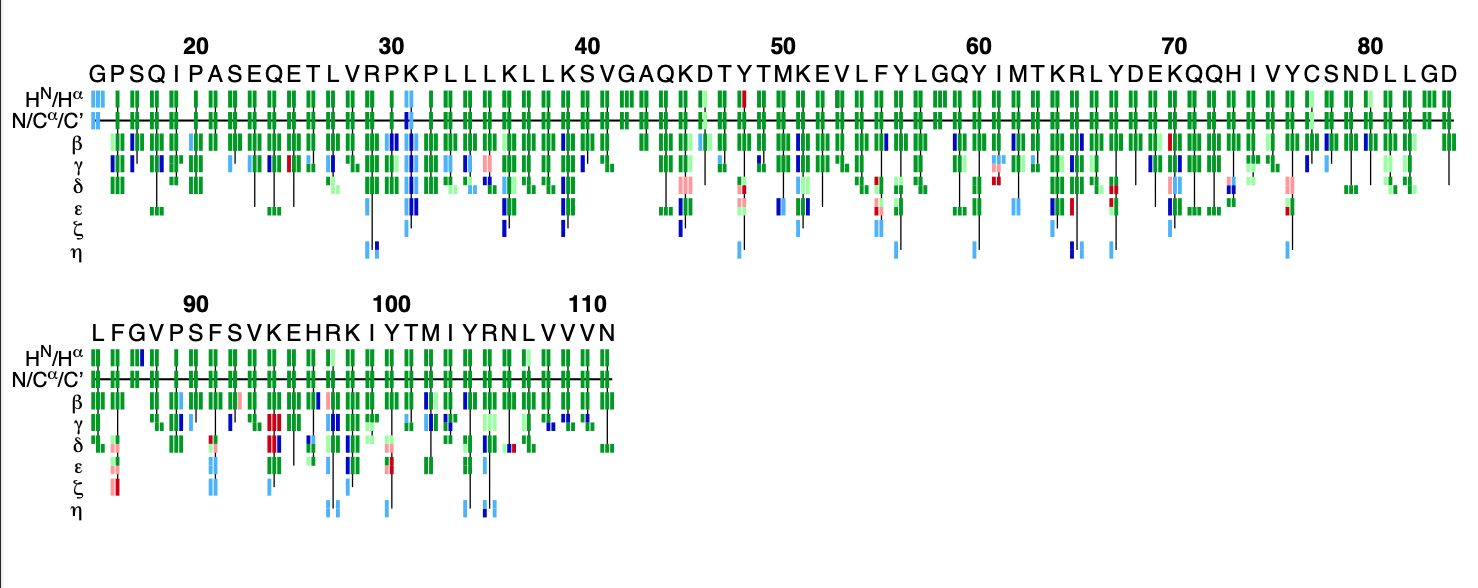
The flya.pdf file
This PDF file provides a graphical representation of the 'flya.tab' file. Each assignment for an atom is represented by a colored rectangle.
 flya.pdf
- Green: Assignment by FLYA agrees with the manually determined reference assignment (within tolerance)
- Red: Assignment by FLYA does not agree with the manually determined reference assignment
- Blue: Assigned by FLYA but no reference available
- Black: With reference assignment but not assigned by FLYA.
Respective light colors indicate assignments not classified as strong by the chemical shift consolidation. The row labeled HN/Hα shows for each residue HN on the left and Hα in the center. The N/Cα/C’ row shows for each residue the N, Cα, and C’ assignments from left to right. The rows β-η show the side-chain assignments for the heavy atoms in the center and hydrogen atoms to the left and right. In the case of branched side-chains, the corresponding row is split into an upper part for one branch and a lower part for the other branch.
Exercise 3: Analyze the FLYA results
- Analyze your FLYA results using 'less' or a graphical text editor and a pdf viewer.
- What do you think?
- How does the automated assignment compare to the provided assignment?
- How robust you think are the results?
- What could you do to likely improve the result?
Hint: Use the terminal command 'gs' to view pdf files (control-C to quit gracefully):
gs flya.pdf
Using Talos to generate torsion angle restraints (optional)
Torsion angle restraints from the backbone chemical shifts help restrict angular conformation space. We wish to use only "strong assignments" to generate these restraints.
If you do not have TALOS installed get it from here. It is part of the nmrpipe software package.
Exercise 4: Calculate backbone torsion angle restraints using Talos
Hint: Copy the FLYA results into a new folder, since otherwise you will overwrite your original 'flya.prot' file.
Essentially you will need to copy the details directory and the 'flya.prot' file.
cp -r flyabb acoPREP
cd acoPREP
rm *.peaks *.out *.job
Use a text editor of your choice to create a 'CALC.cya' file with the commands to calculate the talos angle restraints.
TALOS is used to generate torsion angle restraints from the backbone chemical shifts in 'flya.prot'.
consolidate reference=flya.prot file=flya.tab plot=flya.pdf prot=details/a[0-9][0-9][0-9].prot
This overwrites the original flya.prot with only strong assignments.
read prot flya-strong.prot unknown=skip

talos talos=talosn
talosaco pred.tab

write aco talos.aco
This will call the program TALOS and store the resulting torsion angle restraints in the file 'talos.aco'.
Since this is not a calculation suited for the MPI scheduler, start CYANA first, then call the 'CALC.cya' macro from the prompt.
Hint: change to a cshell before running cyana (since talos needs a cshell to run):
csh
Automated NOESY assignment and structure calculation
We will perform an automated NOE restraint assignment and structure calculation by torsion angle dynamics.
The 'flya.prot' file from the automated resonance assignment will be used together with the (unassigned) NOESY peak lists to assign the NOESY peaks and to generate distance restraints. The structure is calculated in cycles, essentially testing the NOE assignment and iteratively refining it, in order to compute the three-dimensional structure of the protein.
Exercise 5: Run noeassign
Copy the 'flyabb' directory and give it the name 'noebb', then delete all the files and data we do not need to reduce clutter and have better oversight.
cp -r flyabb noebb
cd noebb
rm *asn.peaks *exp.peaks *.out *.job
rm -rf details
From the directory 'acoPREP' copy the calculated talos restraints ('talos.aco').
cp ../acoPREP/talos.aco .
Inside the 'noebb' directory, use a text editor to edit the 'CALC.cya' file for noeassign as outlined.
The noeassign CALC macro
peaks:= cnoesy.peaks,nnoesy.peaks,aro.peaks
prot:= flya.prot
restraints:= talos.aco
tolerance:= 0.040,0.030,0.45
structures:= 100,20
steps:= 10000
randomseed:= 434726

noeassign peaks=$peaks prot=$prot autoaco
To speed up the calculation, you can set optionally in 'CALC.cya':
structures:=50,10
steps=5000
These commands tell the program to calculate, in each cycle, 50 conformers, and to analyze the best 10 of them. 5000 torsion angle dynamics steps will be applied per conformer. If you do not set these option 100 conformers will be calculate, and the 20 best will be analyzed and kept.
When you are done preparing the macros as outlined run the calculation.
The automated NOE assignment and structure calculation will be performed by running the 'CALC.cya' macro:
cyana -n 33 CALC.cya
Doing this, basically means each processor will calculate 100/33=3 conformers. If you changed the setup to calculate 50 structures, you would start the calculation with 'cyana -n 25 CALC.cya'. 7 cycles of calculations will be preformed.
Statistics on the NOE assignment and the structure calculation will be in the file 'Table', which can also be produced with the command 'cyanatable -lp'.
The final structure will be 'final.pdb'. You can visualize it, for example, with the command
chimera final.pdb
The optimal residue range for superposition can be found with the command
cyana overlay final.pdb
Run noeassign with your 'CALC.cya' macro.
You can check the statistics (and success of 'noeassign') by running:
cyanatable
Creating the ligand library file for CYANA
In the next three exercises you will create the ligand library file for CYANA from scratch. Do this carefully and check your result, otherwise your structure calculation will not work as intended.
Exercise 6: Drawing the molecule and obtaining the SMILES code (optional)
- make a copy of the libex and work in there (libexbb)
cp -r libex libexbb
cd libexbb
Go to the ZINC website.
Click on the Structure tab and draw the molecule using the supplied drawing (LIG.png) of the compound as a guide. Copy the SMILES code.
Hint: To look at the supplied image file in the terminal, use:
xdg-open LIG.png
or
open LIG.png
Exercise 7: Converting the SMILES code to mol2 (optional)
- work in the copy of the libex directory ('cd libexbb')
There are many options and programs to do this, we outline two:
If you can use Avogadro (best):
For Mac OS download Avogadro from: Avogadro
Build -- > Insert --> SMILES
Paste the SMILES code
Extensions -- > Optimize Geometry
Save as
--> LIG.mol2 (*.mol2)
If you have to use chimera:
(If you are on the linux server chimera is installed)
Tools --> Structure Editing --> Build Structure Start Structure
--> SMILES string
set the Residue name to LIG (capital letters)
--> Apply Save your mol2 file as: LIG.mol2
Now, there is one issue we have to take care of: The intermolecular NOE assignments have to match the ligand structure assignment, otherwise the intermolecular NOEs will be wrong.
Using the text editor of your choice, manually change the "UNL1" in your mol2 file to "LIG".
Then open the supplied demoLIG.pdb structure in chimera, as well as the created mol2 structure.
chimera demoLIG.pdb LIG.mol2
First check the geometry (especially the rings and the stereochemistry). If it is wrong fix it!
Using the text editor of your choice, or more conveniently using chimera change the proton names in your mol2 file to match those of the pdb.
Hint: Overlay the two ligand structures in chimera.
Favorites --> Command Line
In the command line enter:
match #1 #0
Depending on how the models are loaded you may need to change the #? numbers. To see the model number use the Favorites --> Model Panel.
If chimera complains about "Unequal numbers of atoms chosen for evaluation", delete the pseudo atoms of 'demoLIG.pdb' temporarily for the overlay. In the command line
sel: @Q @Q? @Q??
delete sel
To rename selected atoms (control click) in the command line:
setattr a name HX sel
Hovering over atoms will display their names!
Exercise 8: Converting the mol2 file to a lib file for CYANA (optional)
- work in the copy of the libex directory ('cd libexbb')
- unpack the tool to convert the mol2 to a *.lib file
tar zxf cylib-2.0.tgz
run cylib with the options -nc -sc
./cylib-2.0/cylib -nc -sc LIG.mol2
this will create the LIG.lib file.
The -sc option keeps the angles of the rings fixed. We can do this since they are in this molecule either aromatic or have sp3 conjugated carbons in them, fixing the ring geometry. If they had to be flexible, you would need to keep the angeles flexible and supply additional restraints to close the rings.
To test the lib file we need CYANA:
Create a sequence file containing 'LIG 333' and name the file 'LIG.seq'.
Start CYANA This will read the CYANA library file correctlly but give you the error:
*** ERROR: Illegal residue name "LIG".
*** ERROR: Cannot read line 1:
                     LIG     333
Because we do not have an init file and have not read the 'LIG.lib' file yet, the program just tries to read the default sequence file in the directory, but the ligand is not yet in the library, so it fails...
read lib LIG.lib append
read seq LIG.seq

anneal

atoms select "* - &DUMMY"

pseudo=1
write pdb test.pdb selected
the command pseudo=1 ensures that the pseudo atoms will be in the written pdb file, 'atoms select "* - &DUMMY"' followed by 'write *.pdb selected' prevents the dummy atoms of the linker to be written to pdb.
Hint: Since you might have to do this a few times, until the library is working and correct, it might be worthwhile to create a 'init.cya' and a 'CALC.cya' macro with the respective commands. This to speed things up and prevent the error output shown above.
Carefully analyze the WARNING and ERROR messages if any.
Then take a look at your lig.pdb in chimera and check that the chemistry and bonds are all as expected (ring closure!)
chimera test.pdb
Again overlay the 'LIG.pdb' with the provided 'demoLIG.pdb'.
If there are any issues "go back to the drawing board" to fix the issues. Carefully check the names also of the pseudo atom names, since they are used in intermolecular-NOEs later.
To help find problems, you may use the command:
write lib LIG.lib names
This will write the library file containing actual atom names rather than numbers.
Alternative Exercise 6-8: Converting a pdb file to a lib file for CYANA
In case you were unsuccessful with exercises 6-8 in terms of getting a working ligand library file, do not dispair! There is an easy workaround that you may be able to use in the real case as well, converting a pdb file to a library file for CYANA.
- If you have a PDB file, use Avogadro:
File --> Open
Open the 5c5aLig.pdb
Save as
LIG.mol2 (*.mol2)
Rename the Residue to LIG in the LIG.mol2 file.
- If you already have a mol2 file:
./cylib-2.0/cylib -nc -sc LIG.mol2
Done!
You can run the tests outlined above, using anneal etc to test your library file.
Calculating the structure of the protein-ligand complex
Exercise 9: (Semi-automatic) Intermolecular cross peaks assignment and structure calculation
Since the molecular system contains protein and ligand, CYANA has to read the 'LIG.lib' file in addition to the regular 'cyana.lib' file. The sequence file needs to contain the protein and the ligand (and a linker to connect the two).
Copy the noebb directory and give it the name noecc, then delete all the previous, unnecessary output files to reduce clutter and have better oversight.
cp -r noebb noecc
cd noecc
rm *cycle* *.out *.job final* rama*
cp ../libexbb/LIG.lib .
Update the 'init.cya' file in order to read the ligand library file and the sequence file containing the linker and the ligand.
Ad the 'read lib LIG.lib append' following the 'cyanalib' read command but before reading the sequence. 'append' is necessary, otherwise the 'cyana.lib' file will be overwritten by the 'LIG.lib' file.
rmsdrange:=15-111,333
cyanalib

read lib LIG.lib append
read seq demoLong.seq
Intermolecular cross peaks we assign by supplying noeassign an intermolecular xeasy peak list with just the ligand resonances assigned. The ligand resonance were assigned manually and determined from an additional set of experiments (the semi-automatic part). Thereby the resonance assignment matches the ligand atom assignment in the library file created in the previous exercise.
The protein side will then be assigned by noeassign.
Update the your previous 'CALC.cya' macro by adding the intermol-NOEs.peaks to the peaks list and adding the keep=all option to the noeassign command:
peaks:= cnoesy.peaks,nnoesy.peaks,aro.peaks,intermol-NOEs.peaks
prot:= flya.prot
restraints:= talos.aco
tolerance:= 0.040,0.030,0.45
structures := 100,20
steps:= 10000
randomseed:= 434726
write_peaks_names=.true.
assign_noartifact:="** list=intermol-NOEs.peaks"
noeassign peaks=$peaks prot=$prot keep=all selectcombine="* - @LIG" autoaco
The command 'assign_noartifact' effectivly disables network anchoring tests for the ligand. Since the list supplied is cleaned and presumed artifact free, we are allowed to do this. We therby encourage the use of the intermolecular NOEs even if the support by other nearby NOEs is weak. The command 'write_peaks_names=.true.' ensures that the assigned peak list are written to file with the actual resonance names (this is not xeasy standard).
You can run the calculation again, commenting out (#) the 'assign_noartifact' command, and see the effect on the final structure.
'selectcombine' calls for testing for errors to be done different: Intermolecular peaks do not have to compete with intra protein peaks.
Run the calculation:
cyana -n 33 CALC.cya