


From CYANA Wiki
Jump to: navigation, search
In this tutorial we will determine the resonance assignments and the structure of a protein-ligand complex using modules of CYANA.
...
And ultimately you can try to improve your structure results by studying and applying the options available within the FLYA and noeassign modules of CYANA.
Contents
[hide]Content |
|
|
CYANA setup for the AUREMN Practical NMR Course in Campino (24-26 February 2018)
Please follow the following steps carefully (exact Linux commands are given below; you may copy them to a terminal):
- Go to your home directory (or data directory).
- Get the data for the practical from the server (AUREMN2018.tgz).
- Unpack the input data for the practical.
- Get the demo version of CYANA for this practical.
- Unpack CYANA.
- Setup the CYANA environment variables.
- Change into the newly created directory 'AUREMN2018'.
- Copy the demo_data directory to 'flyabb'.
- Change into the subdirectory 'flyabb'.
- Test whether CYANA can be started by typing its name, 'cyana'.
- Exit from CYANA by typing 'q' or 'quit'.
- Download Chimera (to your personal laptop) from: Chimera
- Download Avogadro (to your personal laptop) from: Avogadro
cd ~
cp /home/julien/AUREMN2018.tar.gz .
tar zxf AUREMN2018.tar.gz

wget 'http://www.cyana.org/wiki/images/6/64/Cyana-3.98bin-180213Demo.tgz'
tar zxf Cyana-3.98bin-180213Demo.tgz
cd cyana-3.98/
./setup

cd ~

cd AUREMN2018
cp -r demo_data flyabb
cd flyabb
CYANA setup
Please follow the following steps carefully (exact Linux commands are given below; you may copy them to a terminal):
- Go to your home directory (or data directory).
- Get the data for the practical from the server (data.zip).
- Unpack the input data for the practical.
- Get the demo version of CYANA for this practical.
- Unpack CYANA.
- Setup the CYANA environment variables.
- Change into the newly created directory 'data'.
- Copy the demo_data directory to 'flyabb'.
- Change into the subdirectory 'flyabb'.
- Test whether CYANA can be started by typing its name, 'cyana'.
- Exit from CYANA by typing 'q' or 'quit'.
- Download Chimera (to your personal laptop) from: Chimera
- Download Avogadro (to your personal laptop) from: Avogadro
cd data
cp -r demo_data flyabb
cd flyabb
cyana
___________________________________________________________________

CYANA 3.98 (mac-intel)

Copyright (c) 2002-17 Peter Guentert. All rights reserved.
_cyana
___________________________________________________________________

CYANA 3.98 (mac-intel)

Copyright (c) 2002-17 Peter Guentert. All rights reserved.
___________________________________________________________________

    Demo license valid for specific sequences until 2018-12-31

    Library file "/Users/deans/cyana-3.98/lib/cyana.lib" read, 41 residue types.
*** ERROR: Illegal residue name "LIG".
*** ERROR: Cannot read line 114:
           LIG  333
cyana> q
...
If you want to return to your practical later, using your own Linux or Mac OS X computer, you can download the demo version of CYANA from here.
Hint: More information on the CYANA commands etc. is in the CYANA 3.0 Reference Manual.
Automated resonance assignment
Resonance assignment within cyana CYANA is done using the module FLYA.
In the most general sense, there are two type of experiments used for protein resonance assignments. Through bond , TOSCY kind of experiments (like TOSCY, COSY) and through space NOESY type of experiments (like NOESY). Each of these two experiments carries distinct information that help the resonance assignment. The HSQC , or HMQC or TROSY elements of these experiments merely help the resolution, by allowing the separation of resonances according to spin types (1H, 13C, 15N) into additional dimensions.
At the very minimum, for small systems and in favorable cases, a NOESY experiment may be sufficient to get an assignment and enough distance restraints for a structure calculation.
Experimental input data
Spectra are processed and referenced relative to each other. Peak lists in XEASY format are prepared by automatic peak picking with a visualization program such as CcpNmr Analysis, NMRdraw or NMRview and saved as XXX.peaks, where XXX denotes the name of the xeasy XEASY peak list file. Then they are cleaned (unnecessary water and noise peaks removed).
...
Linker sequences serve to keep two or more molecules close in coordinate space during calculations, is usually between 15-20 elements long and is composed of dummy atoms that allow the linking.
SPECTRUM definitions in the CYANA library
When you start CYANA, the program reads the library and displays the full path name of the library file. You can open the standard library file to inspect, for example, the NMR experiment definitions that define which expected peaks are generated by FLYA. For instance, the definition for the HNCA spectrum (search for 'HNCA' in the library file 'cyana.lib') is
...
Each line below defines a (formal) magnetization transfer pathway that gives rise to an expected peak. in the case of HNCA there are two lines, corresponding to the intraresidual and sequential peak. For instance, the definition for the intraresidual peak starts with the probability to observe the peak (0.980), followed by a series of atom types, e.g. H_AMI for amide proton etc. An expected peak is generated for each molecular fragment in which these atom types occur connected by single covalent bonds. The atoms whose chemical shifts appear in the spectrum are identified by their labels followed by ':', e.g. for HNCA 'HN:', 'N:', and 'C:'.
Exercise 1: Determine the spectrum type
For the HCCCHToscy, determine the spectrum type and put the definition in the HCCCHTocsy.peaks file with the appropriate syntax.
The experiment is a TOCSY, a through-bond experiment. It allows you to see, in this case, from the backbone all the way out into the side chains.
- Use the less command (to view files in the terminal but not change) to search the spectrum type in the 'cyana.lib' file.
. The additional atom types refer to atoms that are not detected but must be present in a matching molecular fragment. An atom type in parenthesis indicates a branch in the molecular fragment. For instance, in the second magnetization transfer pathway that specifies the sequential HNCA peak, '(C_ALI)' indicates that the atom 'N:N_AMI' must be connected by a covalent bond to both a C_ALI (i.e. CA) and a C_BYL (i.e. C' of the preceding residue).
Exercise 1: Determine the spectrum type
For the HCCCHToscy, determine the spectrum type and put the definition in the HCCCHTocsy.peaks file with the appropriate syntax.
The experiment is a TOCSY, a through-bond experiment. It allows you to see, in this case, from the backbone all the way out into the side chains.
- Use the less command (to view files in the terminal but not change) to search the spectrum type in the 'cyana.lib' file.
Hint: Look at Hint: Look at the definitions themselves and not just the SPECTRUM names, to determine which TOCSY is the appropriate one. Take the experiment with the most through-bond transfers.
...
Hint: For information on how to use the vi terminal editor: vi editor
Exercise 2: Run FLYA
- work in the copy of the data directory ('cd flyabb')
Using the text editor of your choice, create your 'init.cya' macro as outlined (The init macro) and also your 'CALC.cya' macro (The FLYA CALC macro) to run FLYA. Be extra careful to avoid typos and unwanted spaces in coma lists etc.
Execution scripts or "macros" in CYANA
For more complex task within CYANA, rather than to enter the execution commands line by line at the CYANA prompt, the necessary commands are collected in a file named '*.cya'. Collecting the commands in macros has the added advantage, that the macros serve as a record allowing to reconstruct previous calculations.
The init macro
The initialization macro file has the fixed name 'init.cya' and is executed automatically each time CYANA is started. It can also be called any time one wants to reinitialize the program by typing 'init'. It contains normally at least two commands that read the CYANA library and the protein sequence:
...
The protein sequence is stored in three-letter code in the file 'demo.seq'.
The FLYA CALC macro
The 'CALC.cya' starts with the specification of the names of the input peak lists:
...
To run the FLYA calculation, one could start CYANA and execute the 'CALC.cya' macro from the CYANA prompt, however on a computer with multiple processors it is better to speed up the calculation by running the 'CALC.cya' macro in parallel:
cyana -n 10 CALC.cya

This starts 10 independent calculations on 10 processors by using the MPI scheduler (if installed on your system, otherwise shared memory will be used).
It is strongly recommended that you check the MPI scheduler if your calculation is running. If you made a mistake in one of the two macros, the calculation may or may not start, or get interrupted at some point.
...
This command allows you to check whether the calculation has generated intermediary files or final results, with a time stamp.
If you have only one CPU you can start the macro with:
cyana CALC.cyaTo check the general load To check the general load on your local computer use:
...
To kill all processes running (from you):
skill -u <username>
FLYA output files
The FLYA algorithm will produce the following output files:
- flya.prot: Consensus assigned chemical shifts. This file contains a chemical shift for every atom that has been assigned to least one peak.
- flya.tab: Table with details about the chemical shift assignment of each atom (comparison with reference shifts). In this file you can see for each atom whether the assignment is "strong" (self-consistent) or "weak" (only tentative).
- flya.txt: Assignment statistics
- flya.pdf: Graphical representation of the assignment results
- XXX_exp.peaks: List of expected peaks, corresponding to input peak list XXX.peaks
- XXX_asn.peaks: Assigned peak list, corresponding to input peak list XXX.peaks
The flya.txt file
This output file starts with overall assignment statistics for each group of atoms as defined by 'analyzeassign_group:=...':
   ____________________________________________________________

   CHEMICAL SHIFT ASSIGNMENT
   ____________________________________________________________
    SEED: 1

     chemical shifts for 5421151  atoms atoms found

     Peaks assigned from frequencies


     BB: REFERENCES(2):512365 CHEMICALSHIFTS(1):542373 (1)and(2):512365 MATCH:507364(99.0%7% of (2))
- REFERENCES(2) is the number of reference assignments (in the selected group)
- CHEMICALSHIFTS(1) is is the number of atoms assigned by FLYA
- (1)and(2) is the number of atoms that are assigned by FLYA and in the reference.
- MATCH is the number of atoms with the same assignment by FLYA and in the reference. The percentage is relative to the number of reference assignments.
Further below comes a table with information about each peak list:
   PEAKLISTS
 Lists   #Expected:  Total #Expected number noRef of  expectednoPeak peaks
  Assigned   noRef:  Number  of Match expected  peaks #Measured with missing referenceAssigned shifts
    noPeak: Number of expected peaks for wich no peak can be measured
   Assigned: Number of expected peaks that could be assigned
   Match: Number of assigned peaks that fit reference shifts
   #Measured: Total number of peaks in peak list
   Assigned: Number of measured peaks that could be assigned to expected peaks
   exp/meas: Ratio of assigned expected and measured peaks

   Lists      #Expected  noRef   noPeak   Assigned        Match    #Measured Assigned  exp/meas Assigned
   N15HSQC        106       8       1   104( 98.11%)    97( 91.51%)    131     96( 73.28%)   1.1
   HNCA           211      15      11   194( 91.94%)   186( 88.15%)    329    179( 54.41%)   1.1
   HNcaCO         211      15      11   197( 93.36%)   183( 86.73%)    246    176( 71.54%)   1.1
   HNCO           105       7       1   101( 96.19%)    97( 92.38%)    158     97( 61.39%)   1.0
   HNcoCA         105       7       0   101( 96.19%)    97( 92.38%)    158     99( 62.66%)   1.0
   CBCANH         399      26      25   361( 90.48%)   350( 87.72%)    623    339( 54.41%)   1.1
   CBCAcoNH       200      13       2   196( 98.00%)   185( 92.50%)    324    192( 59.26%)   1.0
   ALL           1337      91      51  1254( 93.79%)  1195( 89.38%)   1969   1178( 59.83%)   1.1
It contains the following data:
- #Expected: Total number of expected peaks
- noRef: Number of expected peaks with missing reference shifts
- noPeak: Number of expected peaks for which no peak can be measured
- Assigned: Number of expected peaks that could be assigned based on the reference chemical shift assignments. The theoretical maximum of 100% corresponds to the situation that the spectra “explain” all expected peaks. Each expected peak can be mapped to at most one measured peak. Remaining expected peaks correspond to missing peaks in the measured peak list.
- Match: Number of assigned peaks that fit (within tolerance) reference shifts. The theoretical maximum of 100% corresponds to having all measured peaks assigned. Note that several expected peaks can be mapped to the same measured peak, i.e. the assignments of measured peaks can be unambiguous or ambiguous. Remaining unassigned measured peaks are likely to be artifacts.
- #Measured: Total number of peaks in peak list
- Assigned: Number of measured peaks that could be assigned to expected peaks
- exp/meas: Ratio of assigned expected and measured peaks
There is more information on the results of the assignment calculation in the 'flya.txt' file (not described here).
The flya.tab file
This file provides information about the chemical shift assignment of each individual atom:
exp/meas Assigned
    aro           4732    1212    3334   218(  4.61%)   103(  2.18%)    121     72( 59.50%)   3.0
    cnoesy        4732    1212    1277  3098( 65.47%)  2163( 45.71%)   2904   2123( 73.11%)   1.5
    nnoesy        1562     429     285   958( 61.33%)   832( 53.27%)    970    785( 80.93%)   1.2
    HNtrosy        141      35      16    94( 66.67%)    90( 63.83%)    105     90( 85.71%)   1.0
    trHNCA         183       3       4   178( 97.27%)   176( 96.17%)    180    176( 97.78%)   1.0
    HNCOCA          91       1       1    89( 97.80%)    89( 97.80%)     94     89( 94.68%)   1.0
    HNCACB         356       4      53   300( 84.27%)   297( 83.43%)    290    287( 98.97%)   1.0
    NTocsy         610     172     131   338( 55.41%)   303( 49.67%)    306    290( 94.77%)   1.2
    HCCCHTocsy    2757     738    1474   780( 28.29%)   533( 19.33%)   1429    480( 33.59%)   1.6
    ALL          15164    3806    6575  6053( 39.92%)  4586( 30.24%)   6399   4392( 68.64%)   1.4
It contains the following data:
- #Expected: Total number of expected peaks
- noRef: Number of expected peaks with missing reference shifts
- noPeak: Number of expected peaks for which no peak can be measured
- Assigned: Number of expected peaks that could be assigned based on the reference chemical shift assignments. The theoretical maximum of 100% corresponds to the situation that the spectra “explain” all expected peaks. Each expected peak can be mapped to at most one measured peak. Remaining expected peaks correspond to missing peaks in the measured peak list.
- Match: Number of assigned peaks that fit (within tolerance) reference shifts. The theoretical maximum of 100% corresponds to having all measured peaks assigned. Note that several expected peaks can be mapped to the same measured peak, i.e. the assignments of measured peaks can be unambiguous or ambiguous. Remaining unassigned measured peaks are likely to be artifacts.
- #Measured: Total number of peaks in peak list
- Assigned: Number of measured peaks that could be assigned to expected peaks
- exp/meas: Ratio of assigned expected and measured peaks
There is more information on the results of the assignment calculation in the 'flya.txt' file (not described here).
The flya.tab file
This file provides information about the chemical shift assignment of each individual atom:
   Atom  Residue      Ref   Shift     Dev     Atom  Residue      Ref   Shift     Dev  Extent  inside   inref
   ...
     N     GLY   GLY15     57  102.109  102108.043212     0.066       10 10.0    100 60.0     1000.0  strong=

    H     GLY   GLY15     57      8.571088     8.570       10.0.001     10 61.01     1000.0
    CA 100.0   GLY strong=
  15   CA       44.874 GLY      57    45 10.4150   45 73.4339     -0.0180
    HA2   10.0GLY   15 100.0      100.0   strong=
   HA2   GLY   57   4.042
   HA3   GLY   57   3.436
   C     GLY   57 173.621 173.662  -0.041    10.0    89.4    90.0  strong=
   N     LEU   58 120.640 120.649  -0.009    10.0    80.0    80.0  =
   H     LEU   58   7.488   7.492  -0.004    10.0    79.8    80.0  =
   CA    LEU   58  51.943  51.940   0.003    10.0    70.0    70.0  =
   HA    LEU   58   4.995
   CB    LEU   58  45.602  45.568   0.034    10.0    82.7    80.0  strong=
   CG    LEU   58  26.528
   HG    LEU   58   1.515
   CD1   LEU   58  24.745
   C     LEU   58 173.619 174.576  -0.957    10.0    40.1    10.0  ! (C 59)
     3.705            10.0    39.4     0.0
    HA3   GLY   15           4.147            10.0    40.0     0.0
    CA    PRO   16  62.547  62.554  -0.007    10.0   100.0   100.0  strong=
    HA    PRO   16   4.211   4.213  -0.002    10.0    99.9   100.0  strong=
    CB    PRO   16  31.786  31.791  -0.005    10.0    99.9   100.0  strong=
    HB2   PRO   16   1.675   1.670   0.005    10.0    79.7    80.0  =
    HB3   PRO   16   2.027   2.027   0.000    10.0   100.0   100.0  strong=
    CG    PRO   16  26.536  26.533   0.003    10.0   100.0   100.0  strong=
    HG2   PRO   16           1.727            10.0    99.9     0.0  strong
    HG3   PRO   16   1.726   1.727  -0.001    10.0   100.0   100.0  strong=
    CD    PRO   16  49.122  49.122   0.000    10.0    90.0    90.0  strong=
    HD2   PRO   16   3.282   3.287  -0.005    10.0    99.8   100.0  strong=
    HD3   PRO   16   3.304   3.290   0.014    10.0    89.9    90.0  strong=
...
- Ref: Chemical shift value in the reference chemical shift list (ref.prot). It was not used in the calculation.
- Shift: Consensus chemical shift value from FLYA
- Dev = Ref - Shift
- Extent: Number of runs in which the atom was assigned by FLYA.
- Inside: Percentage of chemical shift values from the (10) independent runs of FLYA that agree (within the tolerance) with the consensus value.
- inref: Percentage of chemical shift values from the (10) independent runs of FLYA that agree (within the tolerance) with the reference value.
- Outcome of the assignment:
- strong: "strong" assignment, i.e. Inside > 80%.
- =: Assignment that agrees with reference, i.e. Dev < tolerance.
- !: Assignment that does not agree with the reference, i.e. Dev > tolerance.
- (atom name): Correct assignment, if within the same residue (no residue number given), or the neighboring residues.
The flya.pdf file
This PDF file provides a graphical representation of the 'flya.tab' file. Each assignment for an atom is represented by a colored rectangle.

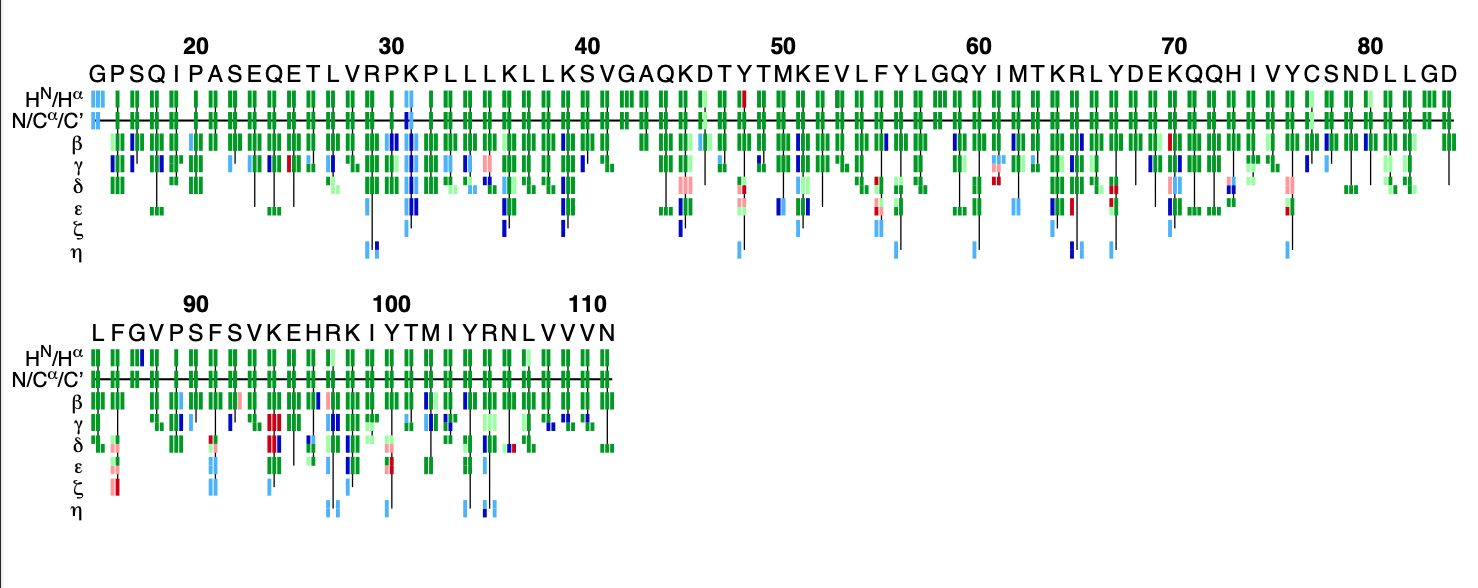
- Green: Assignment by FLYA agrees with the manually determined reference assignment (within tolerance)
- Red: Assignment by FLYA does not agree with the manually determined reference assignment
- Blue: Assigned by FLYA but no reference available
- Black: With reference assignment but not assigned by FLYA.
Respective light colors indicate assignments not classified as strong by the chemical shift consolidation. The row labeled HN/Hα shows for each residue HN on the left and Hα in the center. The N/Cα/C’ row shows for each residue the N, Cα, and C’ assignments from left to right. The rows β-η show the side-chain assignments for the heavy atoms in the center and hydrogen atoms to the left and right. In the case of branched side-chains, the corresponding row is split into an upper part for one branch and a lower part for the other branch.
Exercise 3: Analyze the FLYA results
- Analyze your FLYA results using 'less' or a graphical text editor and a pdf viewer.
...
Hint: Use the terminal command 'gs' to view pdf files (control-C to quit gracefully):
gs flya.pdf
Using Talos to generate torsion angle restraints (optional)
Torsion angle restraints from the backbone chemical shifts help restrict angular conformation space. We wish to use only "strong assignments" to generate these restraints.
If you do not have TALOS installed get it from here. It is part of the nmrpipe software package.
Exercise 4: Calculate backbone torsion angle restraints using Talos
Hint: Copy the FLYA results into a new folder, since otherwise you will overwrite your original 'flya.prot' file.
...
read prot flya-strong.prot unknown=skip

talos talos=talos+talosn
talosaco pred.tab

write aco talos.aco
This will call the program TALOS + and store the resulting torsion angle restraints in the file 'talos.aco'.
...
Hint: change to a cshell before running cyana (since talos needs a cshell to run):
csh
Automated NOESY assignment and structure calculation
We will perform an automated NOE restraint assignment and structure calculation by torsion angle dynamics.
The 'flya.prot' file from the automated resonance assignment will be used together with the (unassigned) NOESY peak lists to assign the NOESY peaks and to generate distance restraints. The structure is calculated in cycles, essentially testing the NOE assignment and iteratively refining it, in order to compute the three-dimensional structure of the protein.
Exercise 5: Run noeassign
Copy the 'flyabb' directory and give it the name 'noebb', then delete all the files and data we do not need to reduce clutter and have better oversight.
...
From the directory 'acoPREP' copy the calculated talos restraints ('talos.aco').
cp ../acoPREP/talos.aco .Inside the 'noebb' directory, use a text editor to edit the 'CALC.cya' file for noeassign as outlined.
The noeassign CALC macro
peaks:= cnoesy.peaks,nnoesy.peaks,aro.peaks
prot:= flya.prot
restraints:= talos.aco
tolerance:= 0.040,0.030,0.45
structures structures:= 100,20
steps:= 10000
randomseed:= 434726

noeassign peaks=$peaks prot=$prot autoaco
...
You can check the statistics (and success of 'noeassign') by running:
cyanatable
Creating the ligand library file for CYANA
In the next three exercises you will create the ligand library file for CYANA from scratch. Do this carefully and check your result, otherwise your structure calculation will not work as intended.
Exercise 6: Drawing the molecule and obtaining the SMILES code (optional)
- make a copy of the libex and work in there (libexbb)
...
Hint: To look at the supplied image file in the terminal, use:
xdg-open LIG.png
or
open LIG.png
Exercise 7: Converting the SMILES code to mol2 (optional)
- work in the copy of the libex directory ('cd libexbb')
...
Hovering over atoms will display their names!
Exercise 8: Converting the mol2 file to a lib file for CYANA (optional)
- work in the copy of the libex directory ('cd libexbb')
- unpack the tool to convert the mol2 to a *.lib file
...
This will write the library file containing actual atom names rather than numbers.
Alternative Exercise 6-8: Converting a pdb file to a lib file for CYANA
In case you were unsuccessful with exercises 6-8 in terms of getting a working ligand library file, do not dispair! There is an easy workaround that you may be able to use in the real case as well, converting a pdb file to a library file for CYANA.Use
- If you have a PDB file, use Avogadro:
File --> Open
Open the 5c5aLig.pdb
...
Rename the Residue to LIG in the LIG.mol2 file.
- If you already have a mol2 file:
./cylib-2.0/cylib -nc -sc LIG.mol2
...
You can run the tests outlined above, using anneal etc to test your library file.
Calculating the structure of the protein-ligand complex
Exercise 9: (Semi-automatic) Intermolecular cross peaks assignment and structure calculation
Since the molecular system contains protein and ligand, CYANA has to read the 'LIG.lib' file in addition to the regular 'cyana.lib' file. The sequence file needs to contain the protein and the ligand (and a linker to connect the two).
...
cp -r noebb noecc
cd noecc
rm *cycle* *.out *.job final* rama*
cp ../libexbb/LIG.lib .
Update the 'init.cya' file in order to read the ligand library file and the sequence file containing the linker and the ligand.
...
The command 'assign_noartifact' effectivly disables network anchoring tests for the ligand. Since the list supplied is cleaned and presumed artifact free, we are allowed to do this. We therby encourage the use of the intermolecular NEOs even if the support by other nearby NOEs is weak. The command 'write_peaks_names=.true.' ensures that the assigned peak list are written to file with the actual resonance names (this is not xeasy standard).
You can run the calculation again, commenting out (#) the 'assign_noartifact' command, and see the effect on the final structure.
'selectcombine' calls for testing for errors to be done different: Intermolecular peaks do not have to compete with intra protein peaks.
Run the calculation:
cyana -n 33 CALC.cya
Comparing the calculated NMR structure to an XRAY reference structure
Exercise 10: Compare the NMR structure to the Xray structure
Download (www.rcsb.org) the xray structure with ID: 5c5a
Use either a web-browser or the terminal:
wget 'https://files.rcsb.org/download/5c5a.pdb'
Using chimera it is possible to compare two structures, by overlaying and inspecting visually.
When you have your xray structure ready, load your calculated nmr structure and the xray structure in chimera.
Use to chimera specific commands to overlay the two structures and compare the structures visually.
Exercise 11: Preparing an xray structure to use within CYANA
Deposited structures often lack specific features. i.e. Xray structures usually lack proton coordinates.
Copy your noecc results to a new directory call regulabb, then delete all the previous, unnecessary output files to reduce clutter and have better oversight.
cp -r noecc regulabb
cd regulabb
rm *cycle* *.out *.job
After reading the sequence file, the pdb file can be read with the option unknown=warn or unknown=skip, this will then skip the parts of the molecule not specified in the sequence file.
read pdb xxxx.pdb unknown=warn
Other options to read pdb's:
read 5c5a.pdb unknown=warn hetatm new
where the option 'hetatm' allows for reading of coordinate labeled HETATM, rather than ATOM in the pdb. 'new' will read the sequence from the pdb.
To write back out pdb's and sequences:
write pdb XXX.pdb
write seq XXX.seq
Inspect the pdb using chimera: Now, there are several issues besides HETATM, that make the comparison to the calculated NMR structure not possible within CYANA before you fix them. You may use a graphical text editor to fix them. In the end, you need to have a conformer of the complex ready to compare with the calculated NMR structure.
Best would be to practice the use of the 'regularize' command as well. This is however not really necessary in this particular case, since this xray structure contains proton coordinates. Using the regularize command one can get a structure calculated within CYANA that has these features but still is very close to the input structure of your choice.
Copy your 'LIG.lib' file and name it 'NUT.lib', in the 'NUT.lib' file change the residue name from LIG to NUT. The 'NUT.lib' file is necessary to read the original xray structure with ligand into CYANA.
Copy the 'demoLong.seq' file and name it 'demoLongEd.seq', in the 'demoLongEd.seq' file delete the linker residues.
Create an 'init.cya' macro with:
cyanalib
read lib LIG.lib append
Then create a 'CALC_reg.cya' macro with:
read lib NUT.lib append
read 5c5a.pdb unknown=warn hetatm new
write 5c5a_Ed.seq
write 5c5a_Ed.pdb

#renumber and rename the ligand from 201 333, NUT to LIG
library rename "@NUT" residue=LIG
atoms select @LIG
atoms set residue=333

write 5c5a_renum.seq
write 5c5a_renum.pdb

#sequence with ligand but without linker
read demoLongEd.seq
read 5c5a_renum.pdb rigid unknown=warn

write XrayAChainRenum.pdb

initialize

read seq demoLong.seq
read pdb XrayAChainRenum.pdb unknown=warn

write pdb test.pdb

read pdb test.pdb
regularize steps=20000 link=LL keep
Execute the 'CALC_reg.cya' macro in the CYANA shell (or use only one processor, do not distribute the job):
cyana CALC_reg.cya
Exercise 12: Calclulate the RMSD of NMR vs. xray structure using a CYANA macro
Using the INCLAN language of CYANA (Writing and using INCLAN macros,Using INCLAN variables,Using INCLAN control statements) it is possible to write complex macros that interact with the FORTRAN code of CYANA. Reading internal variables and manipulating them to achieves custom task.
- save the manually edited xray structure (exercise 11) or the the regularized xray structure (containing the ligand and called 'regula.pdb') as 'reg_xray.pdb' to use the macro below (or change the name in the macro accordingly).
- what do you think about the RMSD, does the value make sense? Does the range make sense?
Below you find the commands for a macro (call it 'CALC_RMSD.cya') that will read the regularized xray structure and the calculated nmr structure, then calculating the rmsd of both the protein and ligand parts of the complex:
read demoLong.seq

rmsd range=15-111 structure=final.pdb reference=reg_xray.pdb

atom select "BACKBONE 15-111"
t=rmsdmean
j=rindex('333')
n=0
s=0.0
do i ifira(j) ifira(j+1)-1
  if (element(i).gt.1) then
    n=n+1
    s=s+displacement(i)
   end if
end do
print "RMSD of the LIG: ${s/n} ($n atoms)"

read pdb final.pdb
structure mean
write pdb mean.pdb

read pdb mean.pdb
read pdb reg_xray.pdb append

atom select "BACKBONE 15-111"
t=rmsdmean
atom select "WITHCOORDALL"
j=rindex('333')
n=0
s=0.0
do i ifira(j) ifira(j+1)-1
  if (element(i).gt.1.and.asel(i)) then
    n=n+1
    s=s+displacement(i)*2
  end if
end do
print "Displacement of the LIG (to ref xray): ${s/n} ($n atoms)"
Beyond The Basics: Improving the final structure
FLYA options
There are a variety of commands to modify FLYA runs to accommodate experimental labeling schemes or apply previous assignments etc...
Modify the chemical shift statistics used for assignment
Supply user-defined chemical shift statistics instead of standard BMRB statistics from library and replace the general statistics from 'cyana.lib' (CSTABLE).
- average value and stddev from input chemical shift list 'shiftx.prot'
- 'assigncs_sd:=bmrb' to use stddev from BMRB ('cyana.lib') instead of input chemical shift list
- 'assigncs_sdfactor:=0.5' to scale BMRB stddev by given factor
shiftassign_statistics:=predicted.prot
...
Groups of atoms for which assignment statistics will be calculated and reported in the 'flya.txt' output file can be defined as:
analyzeassign_group := BB: N H CA CB C
In this case, the command defines a group called BB (a name that can be chosen freely) comprising the atoms N, H, CA, CB, C.
...
' effectivly disables network anchoring tests for the ligand. Since the list supplied is cleaned and presumed artifact free, we are allowed to do this. We therby encourage the use of the intermolecular NOEs even if the support by other nearby NOEs is weak. The command 'write_peaks_names=.true.' ensures that the assigned peak list are written to file with the actual resonance names (this is not xeasy standard).
You can run the calculation again, commenting out (#) the 'assign_noartifact' command, and see the effect on the final structure.
'selectcombine' calls for testing for errors to be done different: Intermolecular peaks do not have to compete with intra protein peaks.
Run the calculation:
cyana -n 33 CALC.cya
shiftassign_reference:=manREF.prot
The same parameter may also be set as part of the flya command:
flya runs=10 assignpeaks=$peaks shiftreference=manREF.prot
...
Specific labeling can be handled and peak list-specific atom selections can be applied.
To restrict the generation of expected peaks to a subset of atoms, here the backbone atoms:
command select_atoms
  atom select "N H CA CB C"
end
...
- specify with parameter 'structure' of the command 'flya'
- if parameter 'structure' is absent, a set of random structures is generated automatically
- if set to blank ('structure='), no random structures are generated (if not needed because only through-bond spectra are used)
flya runs=10 assignpeaks=$peaks structure=XXX.pdb
Experimental peaks may also be employed as expected peak lists:
- command N15NOESY_expect, reading input peak list N15NOESY_in.peaks
N15NOESY_expect :=N15NOESY_in
...
To keep input peak assignments in user peak assignments:
- (partially) assigned input peak list XXX.peaks
- parameter 'keepassigned' for 'loadspectra.cya'
loadspectra_keepassigned:=.true.
To fix input chemical shift assignments contained in a prot file
To do this i.e for backbone atoms extracted from the manREF.prot list:
Make a list of only the reference backbone chemical shifts by entering the CYANA commands:
read manREF.prot
  atom set "* - H N CA CB C" shift=none
write fix.prot
The file 'fix.prot' will contain the reference chemical shifts only for the backbone (and CB) atoms H, N, CA, CB, C'. Now you can repeat the assignment calculation by inserting the 'shiftassign_fix:=fix.prot' statement in 'CALC.cya' and choosing only the input peak lists that are relevant for sidechain assignment:
shiftassign_fix:=fix.prot
...
- increased population size with 'shiftassign_population=200'
- see Schmidt et al. J. Biomol. NMR 57, 193-204 (2013)
...
Serves the fast automated chemical shift assignment and means the results in general are less accurate since either the populations are smaller, there are less parallel runs or the optimization schedule is modified.
In production runs, better results can be expected (at the expense of longer computation times) if these parameters are not set.
...
Fixed number of generations in evolutionary optimization:
shiftassign_population=25
The population size for the genetic algorithm, i.e. how many assignments form one generation (25; chosen smaller than in normal production runs in order to speed up the calculation).
There is also an option to choose the "quick" optimization schedule:
shiftassign_quick=.true.
And last the 'runs' option can be set for flya as we did in the exercise ('flya runs=10').
neoassign options
To learn more about noeassign consult the tutorial Structure calculation with automated NOESY assignment. Other options for neoassign are described here: CYANA_Macro:_noeassign
Exercise 13: Mapping restraints onto a known structure
One can map the calculated restraints, such as distance restraints (upl/lol) onto a known structure (in the example here an xray structure). This is another approach to analyze restraints and their influence on the results.
Below you find the commands to accomplish this. You see by studying the commands, which files are needed to execute the macro. Therefore, create a new directory ('mkdir') or copy a directory containing the respective files. Delete what you do not need. Use the regularized xray structure from exercise 11.
Commands preceded by hashtags (#) are commented out, remove the hashtags if you want to use them. If you decide to use the intermo-NOEx-cycle7.peaks file, make sure to comment any commands you no longer need.
You need an init file:
rmsdrange:=15-111,333
cyanalib
read lib LIG.lib append
And the main macro (name it 'CALC_xraymap.cya'):
read seq demoLong.seq
The following block of commands, takes the assigned intermol.peaks list and calculates distance restraints from the peak intensities:
#peaks:=intermol-NOEs-cycle7.peaks
#calibration peaks=$peaks
#peaks calibrate simple
#write upl intermol.upl
The following block of commands, reads the 'final.upl' list (in this case of neoassign) and selects the intermolecular NOEs to LIG and writes them to file:
read upl final.upl
distance select "*, @LIG" info=full
write intermol.upl
read intermol.upl unknown=warn

#read upl lig.upl append
#read lol lig.lol

read regula.pdb unknown=warn

weight_vdw=0
overview intermol_xray.ovw
- If the restraints do not match with the xray structure, does it mean they are wrong?
- If you tried the two options, what is (are) the difference(s)?
- Did you look at the LIG.upl/lol files in the demo_data folder, what are they? What type of NMR experiments are there to obtain them?
Exercise 14: Work on improving the final structure
Using what you have learned so far, employing some of the options of FLYA and noeassign, consider if it is possible to improve the resolution of the final structure.
...
- Name additional experimental restraints (or inputs) you could use for structure calculation.
- Name additional NMR experiments you could measure, to acquire experimental data that are not supplied with the demo_data.
Retrieved from "http://www.cyana.org/wiki/index.php?title=Automated_calculation_of_a_protein-ligand_complex_structure_(AUREMN,_Brazil_2018)&oldid=8849"
Views
Personal tools
Navigation
Help
Toolbox
Related
Create Account
...